Assorted
These examples are meant to demonstrate the type of output you can expect to create with protograf. They are not meant to be exhaustive or comprehensive!
Bear in mind that the images shown in these examples are lower-resolution screenshots; the original PDFs that can be generated from the source scripts will demonstrate full scalability.
A Clock
Title |
A Wall Clock |
Script |
|
Discussion |
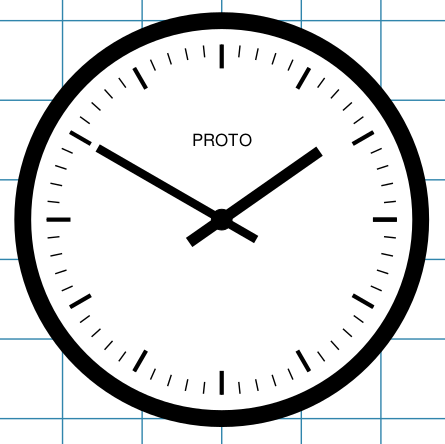
This example shows how to create a complex element - a clock - by combining multiple Circles, each with different properties. Only the first circle — the clock’s outline border and its title — has a fill color set but the rest do not:
The other circles - which each have a fill color of
Here the setting of various radii_ properties allows the marks to be generated. Of interest is the use of the steps() function to create the list of angles needed to specify where the offset radii used for the hours are to be drawn. |
Screenshot |
|
Miscellaneous Things 1
Title |
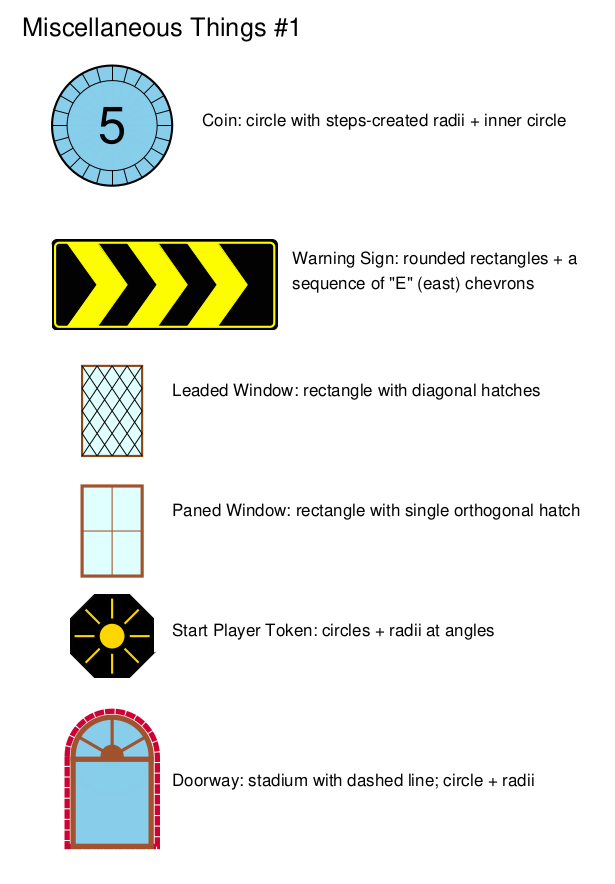
Miscellaneous Things #1 |
Script |
|
Discussion |
The first page of this set of examples shows how to construct various “compound” shapes by making use of special properties of different shapes. |
Screenshot |
|
Miscellaneous Things 2
Title |
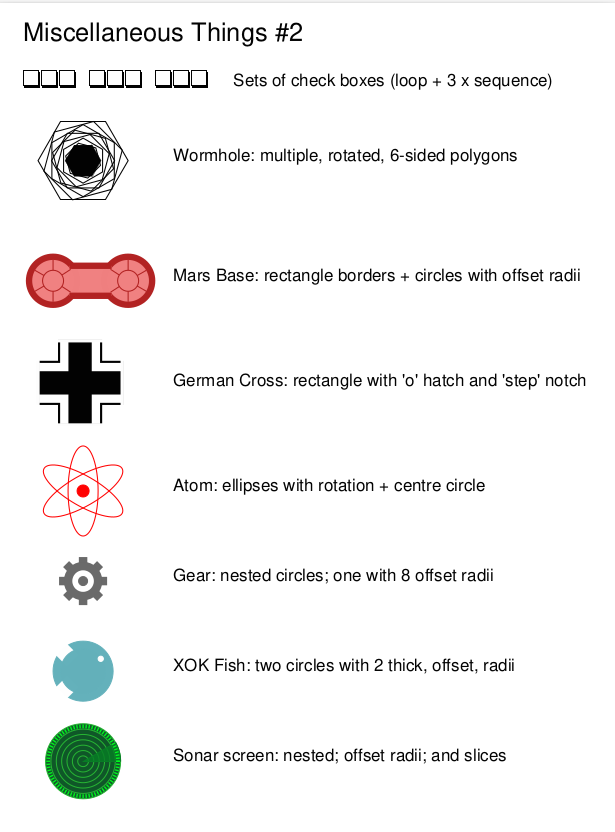
Miscellaneous Things #2 |
Script |
|
Discussion |
The second page of this set of examples shows how to construct various “compound” shapes by making use of special properties of different shapes. |
Screenshot |
|
Miscellaneous Things 3
Title |
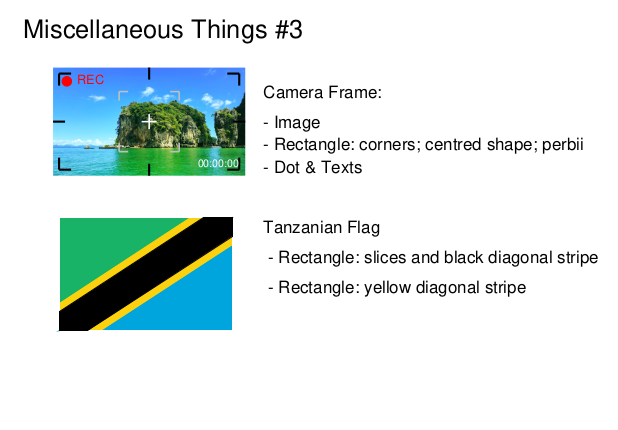
Miscellaneous Things #3 |
Script |
|
Discussion |
The third page of this set of examples shows how to construct various “compound” shapes by making use of special properties of different shapes. |
Screenshot |
|
Chords
Title |
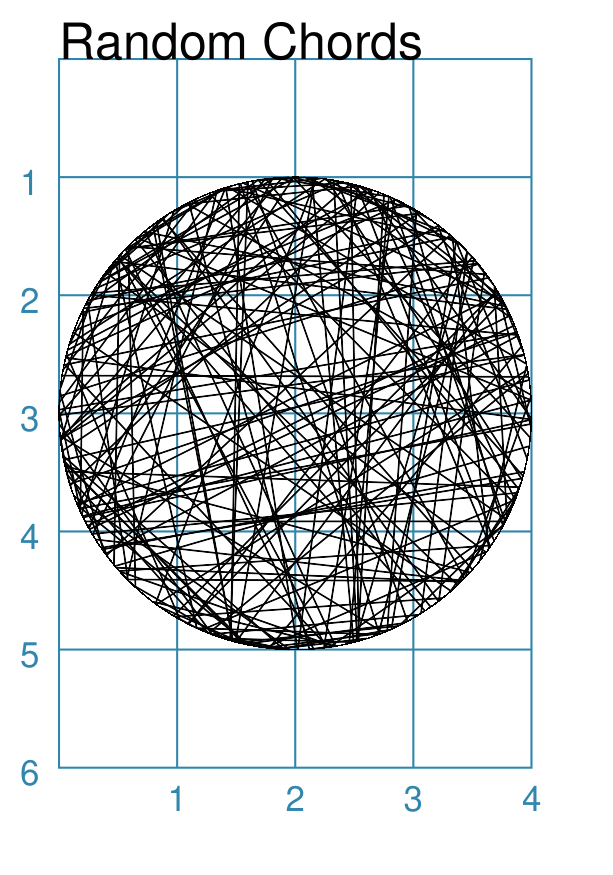
Chords (in a circle) |
Script |
|
Discussion |
This example shows how to construct a simple effect by combining a basic shape — a Chord — with a Python loop:
Here the Also see Python loops for more details. |
Screenshot |
|
Compass Rose
Title |
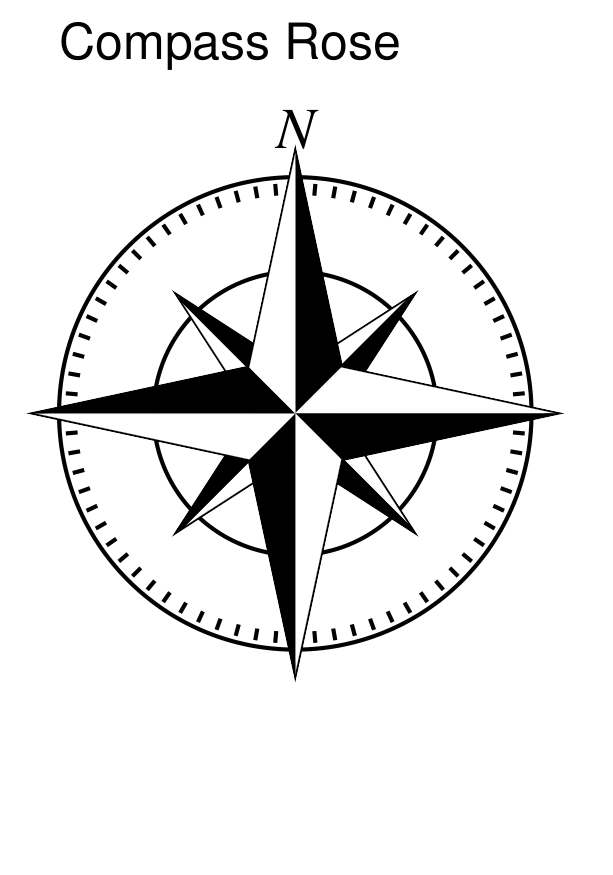
Compass Rose (circles and stars) |
Script |
|
Discussion |
This example shows how to construct the effects of a compass by overlapping Stars onto Circles
|
Screenshot |
|
Rondel
Title |
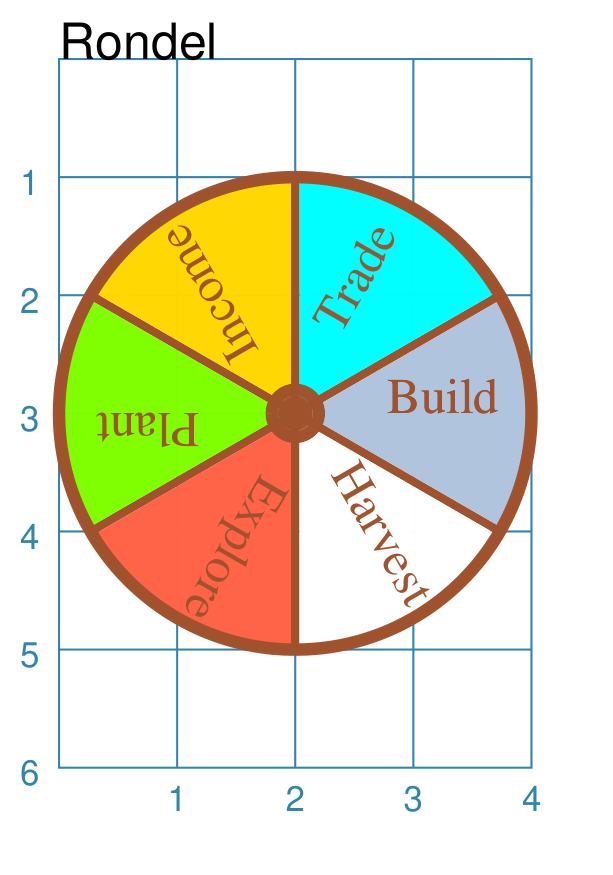
Rondel (circle radii and sectors) |
Script |
|
Discussion |
This example shows how to construct a simple effect by using data from a Python loop combined with radii labels:
In this example, using the “offset” for the radii allows the label — which is centred on the radius line — to be moved further outward. Also see Python loops for more details. |
Screenshot |
|
Process Flow Diagram
Title |
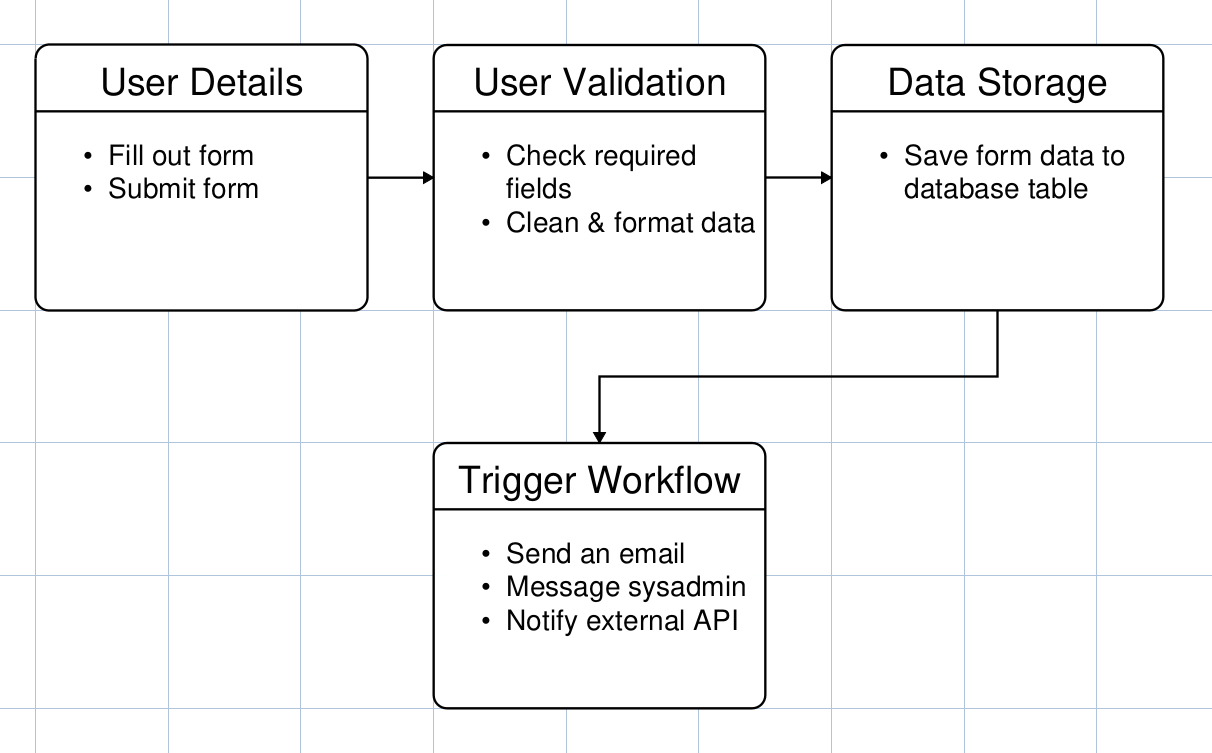
Process Flow Diagram |
Script |
|
Discussion |
This example shows how to construct a diagram by drawing a series of Rectangles with Text as part of a Python function. These Rectangles are then connected by Lines via the link property of each line. Part of the function looks like:
It can be seen that the location of the Rectangle will depend on the x and y values supplied to the function when it is used. The function is used as follows:
Also see Python function for more details on how to construct a function. The connecting lines are drawn as follows:
For more detail about links, see the customised Line section. |
Screenshot |
|
World Clocks
Title |
World Clocks |
Script |
|
Discussion |
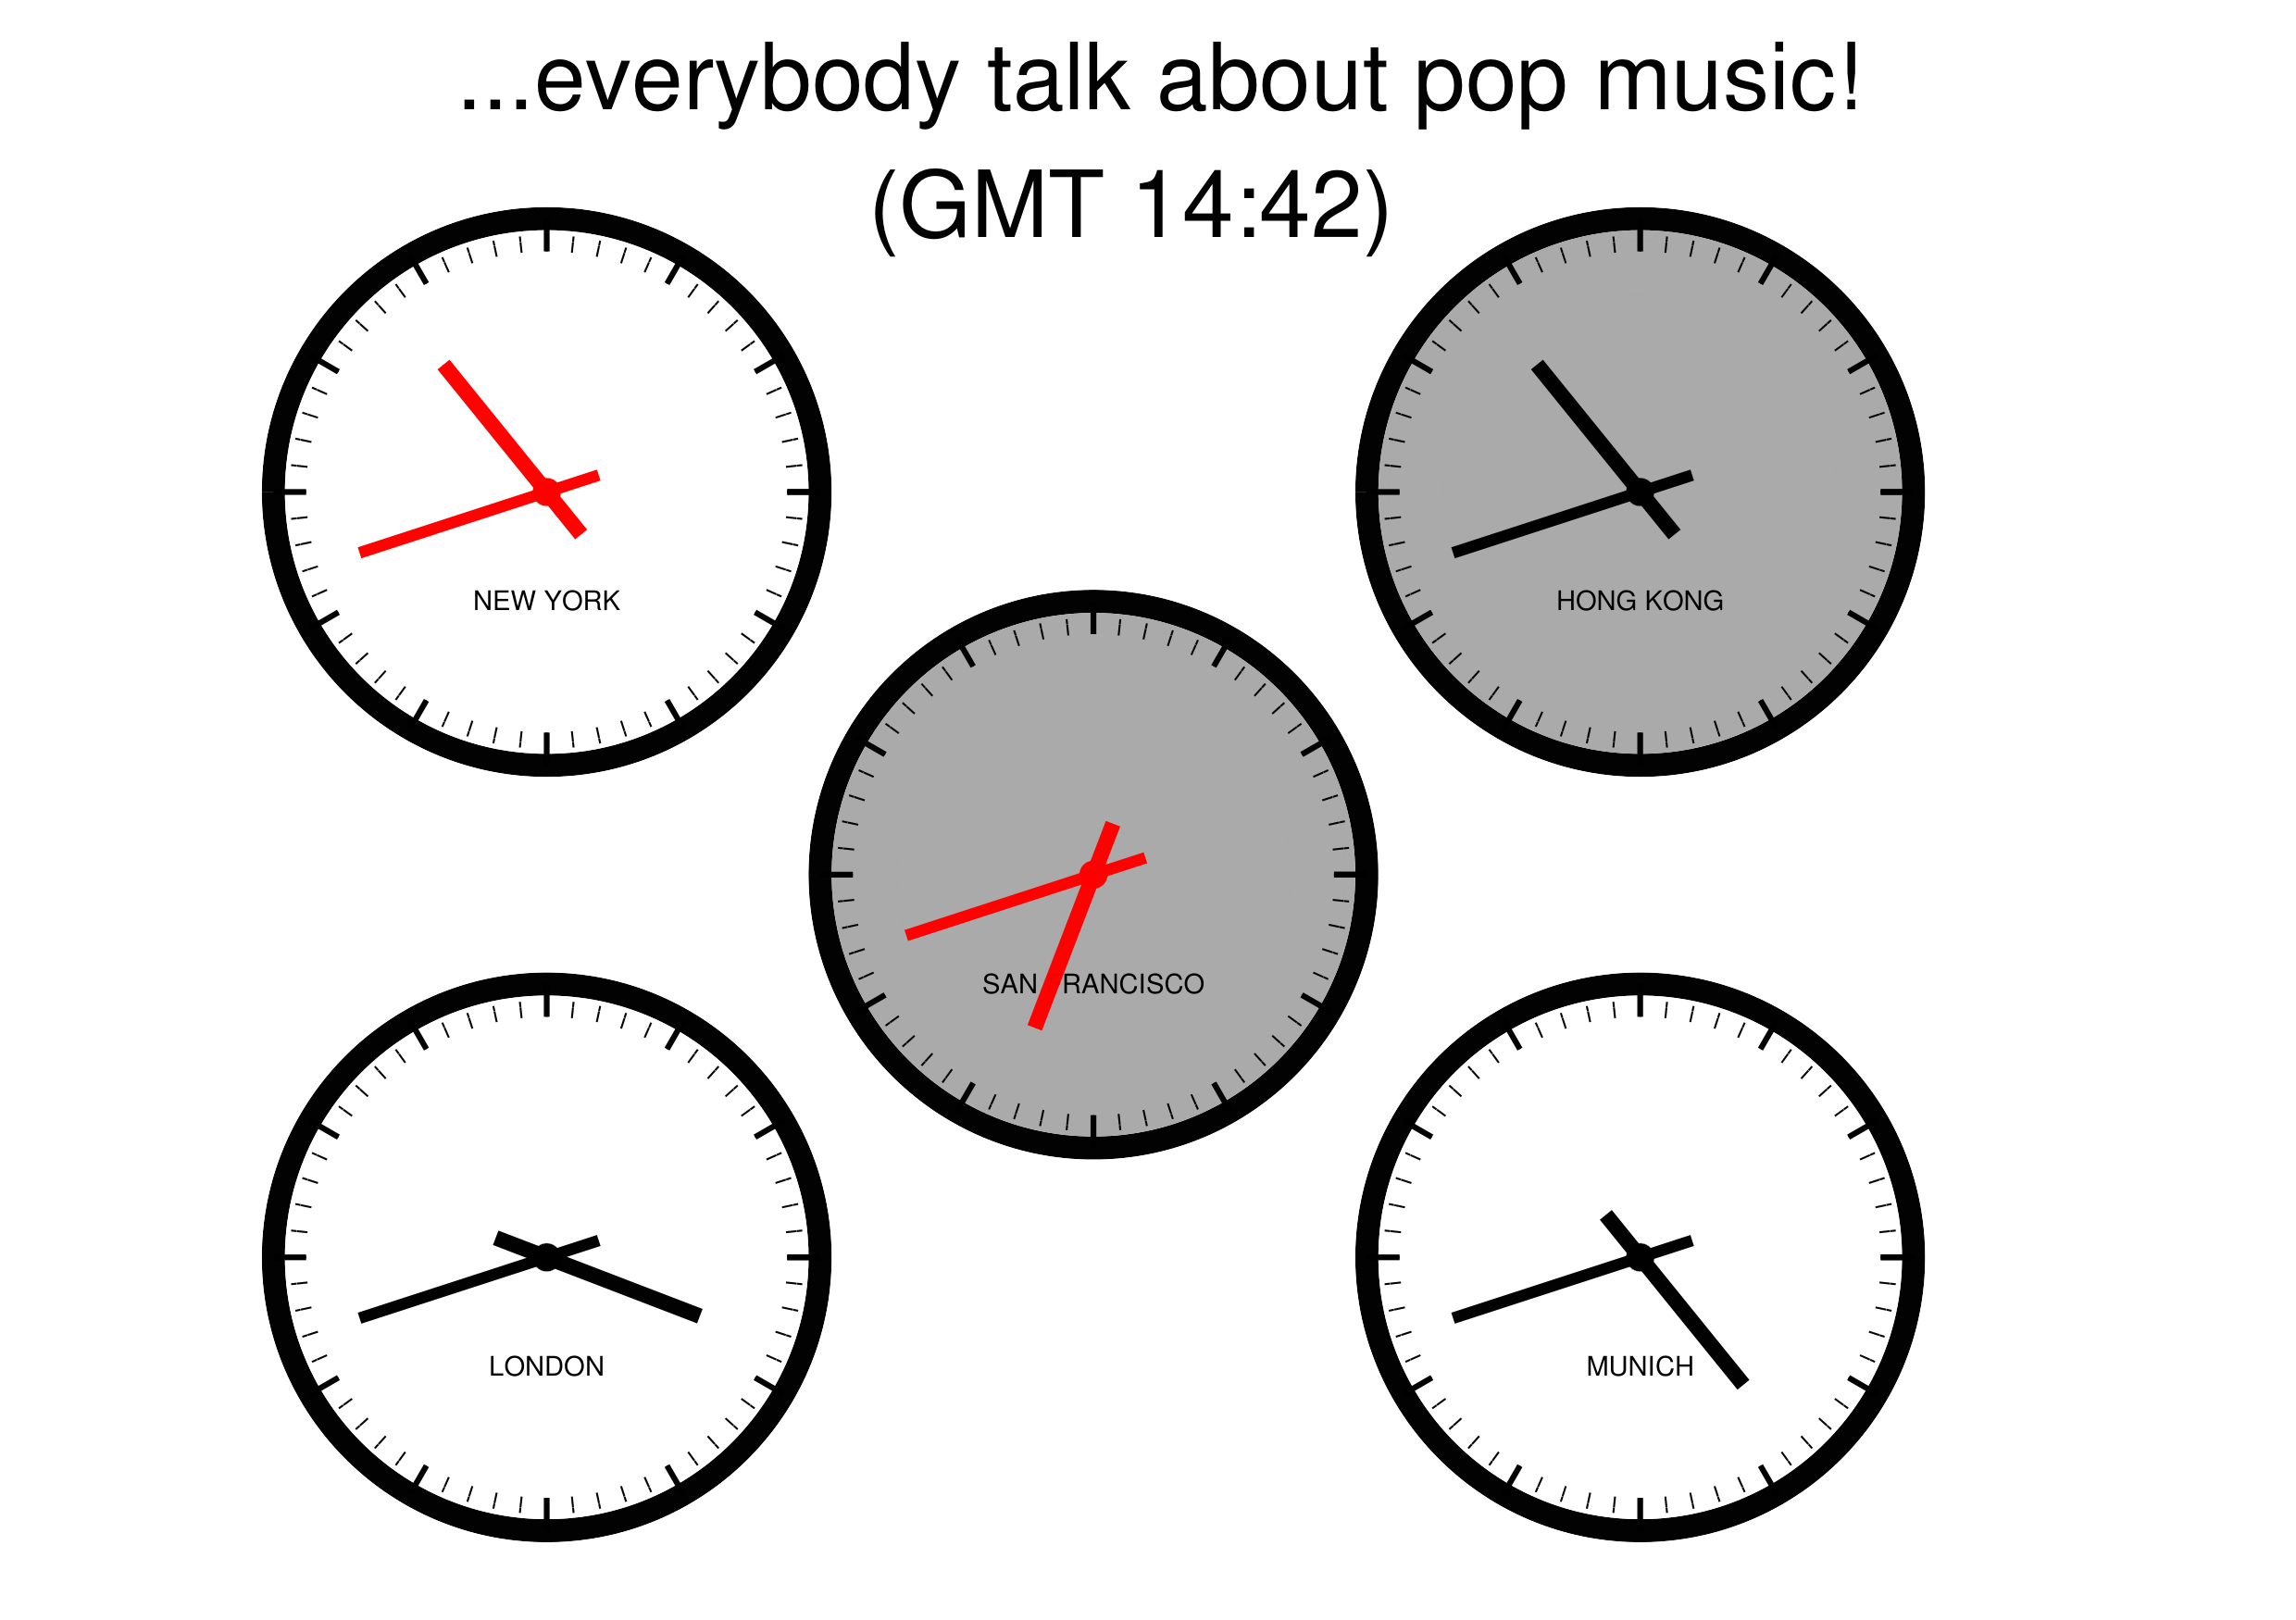
This example shows how to reuse a complex element — a clock — by means of a set of Python functions; see Python functions for more details. This is a fairly complex script — a mini program really — which is likely only to be legible to a Python programmer! It’s probably far beyond the scope of this library’s intended use… The script essentially “wraps” the clock creation approach described above into a function which is accessed for each city, or place, whose clock should be displayed. The script also uses other functions to calculate the position of the clock hands based on the current time of the day; this is a bit fiddly because the hour hand angle changes in relation to the number of minutes. The clock face and the hand colors are changed depending on the day/night and light/dark cycles. Further ideas:
|
Screenshot |
|